Flooding the Market

This post originally published in Seasoned Chaos blog on November 14, 2020, written by Victoria Schoenwald. The blog has been created and written by graduate students at the Rosenstiel School of Marine and Atmospheric Sciences, University of Miami.

Determining where and when coastal flooding will take place and what damages it will cause is like playing the stock market. In order to jump into the high-stakes game of finance, you need an initial investment, which will eventually increase or decrease. To dive into the coastal flooding market, our initial investment is the water level, and we want to see where and when it will go up or down. Tides are the greatest insight into coastal flooding since they determine what time of day and year water will be higher or lower around the world.

Initial Investment: Tides

First, we need to “save up” our knowledge on tides in order to join the market. Tides are influenced by the gravity of the Earth, moon, and sun. In general, the gravitational field of the moon pulls the side of the Earth that is closest to it. Water creates a bulge on the side of the Earth as if it were reaching out to the moon. Due to the inertia of the Earth, there is also a bulge of water on the side of the Earth farthest from the moon. A balance of the forces causes you to experience a high tide when you are on the side of the Earth closest or farthest from the moon (explained further here). The opposite is true for the sides 90° to the moon, resulting in a low tide. Every six hours the tide changes from high to low as the Earth rotates.

Downtrend: Neap Tides

Not only does the tide change from high to low but it also changes throughout the year due to the lunar cycle and the orbit of the Earth and moon around the sun. Neap Tides occur when the sun and the moon are at right angles to each other. The two gravitational fields are working against one other leading to moderate high and low tides.

Mark- Up: Higher Highs and Lower Lows

The opposite is true for when the Earth, sun, and moon are aligned. The gravitational force of the moon and sun combine to pull even more water. High tides will be higher than average and low tides will be lower. We call these Spring Tides and they occur every 14 days during a new and full moon. But wait, these aren’t the highest tides that we experience. When business is booming in the coastal flooding market, the stock price (AKA, the water level) skyrockets to the highest levels all year and we call this the King Tide. These exceptionally high tides can occur when the moon is the closest to the Earth (perigee) or when the Earth is closest to the sun (perihelion).

Seasonal Cycle of Water Levels at Virginia Key, FL

This figure was created by Brian McNoldy, and it shows a seasonal cycle of water levels at one station in Miami, FL. The blue line shows the daily average water level, while the red line shows a monthly smoothing of the daily average water level. You’ll notice that we typically see the highest water levels of the year during the Fall (Sept-Nov), known as King Tide season.

Stockbroker: Brian McNoldy

In order to learn more about the market of coastal flooding, how tides contribute to it, and what other factors will affect it, we will turn to our “stockbroker” (coastal flooding expert), Brian McNoldy (visit his website or Twitter @BMcNoldy. At the University of Miami Rosenstiel School of Marine and Atmospheric Science (RSMAS) Brian studies tropical cyclones with a large interest in sea level rise and climate. We interviewed Brian for some much needed “advice” about coastal flooding in a vulnerable region in the U.S.: south Florida (also home to Seasoned Chaos).

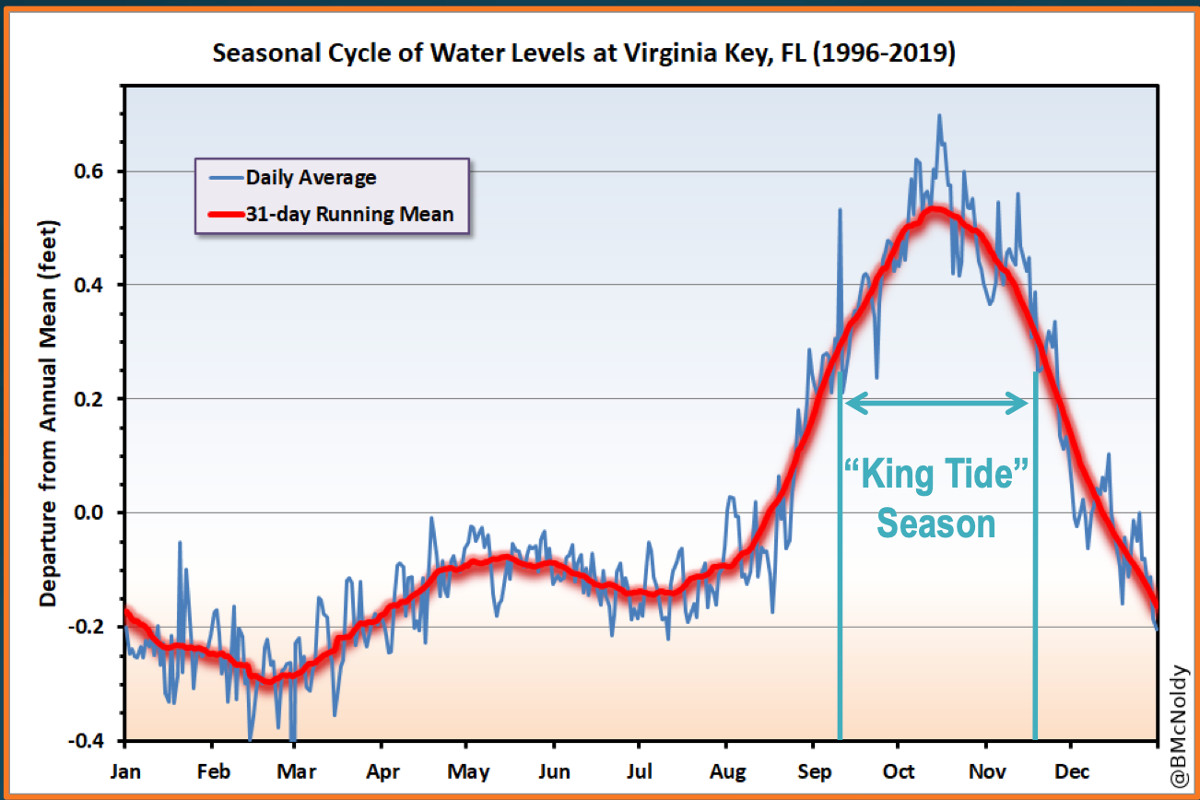
Q: Are King tides getting higher?

Decade by decade, sea level is rising… globally and locally. So, all other things being equal (which they basically are), all tides are higher now than they were 20, 40, 60 years ago. They are more noticeable when they result in flooding of course, so that is what gets the attention. In southeast Florida, we have seen an average increase of about 5.5 inches in the past 25 years (~5.6 mm/yr). Some years, the elliptical orbit of the moon allows its closest approach to Earth to exactly coincide with a new or full moon – and there was a perigean new moon on October 16th this year.**

Q: How is sea level rise contributing to coastal flooding events?

Up and down the U.S. East Coast, coastal areas are experiencing alarming sea level rise rates. South Florida is in that span of course, but places like Annapolis MD, Norfolk VA, Wilmington NC, and Charleston SC are seeing even more rapid rises than we are. The culprit (or a culprit) seems to be a lethargic Gulf Stream. Excessive ice melt from areas in the far northern Atlantic could be altering the large-scale ocean circulation, and one component of that is the Gulf Stream. When it slows down, water along its route piles up: that route happens to be parallel to the U.S. East Coast. The Florida Current (part of Gulf Stream) is weakest during October and water piles up along the Florida east coast.

Slowing Gulfstream along the Florida coast

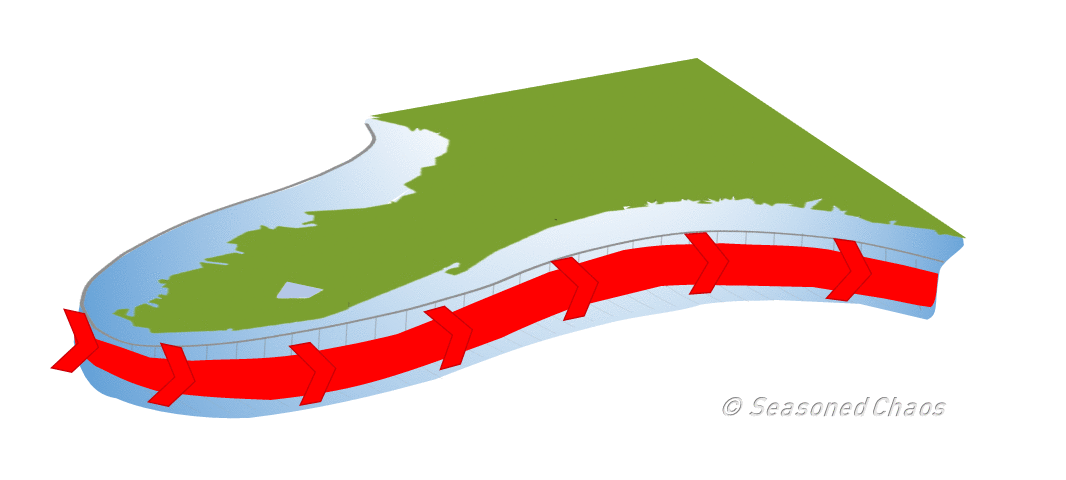
Here we show what Brian is talking about: a slowing Gulf Stream can cause a “build-up” of water along the coast!

Q: Can we predict where coastal flooding will occur?

Yes, mostly. High-resolution maps with detailed elevation data allow for rather accurate illustrations of what areas will flood when the water level reaches some threshold. Predicting the exact maximum water level in advance is tricker, but often the exact value doesn’t matter so much. Just highlighting the areas that are at high risk and the timing of that risk can be quite helpful to cities, residents, and businesses. In other words, telling someone in advance that the tide will peak at 2.12’ MHHW at 10:15am is fine, but is unrealistically and unnecessarily precise. Rather, advising that water levels could exceed 2’ MHHW for the next four days for a few hours around each high tide is more realistic [similar to how we have explained the usefulness of probabilistic forecasting in this blog post!].

Surge Coastal Flooding Market

King tides and coastal flooding may be further amplified by short lived hot spots of sea level rise (> 20 mm/yr). Since we learned from our “stockbroker” Brian that sea level rise (SLR) is contributing to higher than normal king tides and flooding events, it is important to know what parts of the world will experience the greatest increase in SLR in order to predict coastal flooding. Specific locations also see higher than normal tides seasonally. Just like a bad lawsuit, a merger, or a new product could make a stock rise or fall, local and global influences like wind, water temperature, rain, climate change and even the Gulf Stream can lead to dangerous water levels for low lying coastal regions.

Hot spots of sea level rise on the eastern coast of the United States are believed to be related to combined cumulative effects of the Gulf Stream strength and position, as well as ENSO and NAO. In the recent decade accelerated SLR along the east coast has shifted from the mid-Atlantic to the south. This shift has been associated with changes in the Gulf Stream.

The NAO can also influence temperature and rainfall especially in winter, which aligns with the timing of King tides. NAO may change the location of the hot spot. Recent research has also found that El Niño affects global sea levels, though this is a complex topic. In general, climate oscillations impact winds and atmospheric pressure. A lower atmospheric pressure allows seas to rise and stronger onshore winds push water to the coast.

Currently it is difficult to predict where and when these SLR hot spots will occur so we will need to keep an eye out for future research. However, now we have a better grasp on how King tides can affect coastal flooding and we are ready to join the market!

Written by: Victoria Schoenwald


**Brian McNoldy did say more about this season’s king tide flooding predictions, including this past October’s event:

Q: How will this fall’s king tide impact coastal flooding in South Florida?

Similar to previous years, low-lying areas will experience flooding around every high tide for a few days surrounding each full and new moon during “King Tide Season” (August-November). The actual observed water level is often different from the predicted water level, and the amount of that difference means that the peak might not occur on the day of the highest predicted water level. For example, the highest predicted tide of 2020 is on the morning of October 17th. But it is very possible that it won’t end up being the highest water level of the year.