The Subseasonal Experiment - SubX

Originally published by Robert C. Jones Jr. in MIAMI Spring 2021 magazine online edition on June 23, 2021.

A long-range system spearheaded by Ben Kirtman, a University of Miami atmospheric scientist, is helping to predict weather hazards weeks in advance.

They said it couldn’t be done—that a forecast model capable of predicting environmental hazards up to 30 days out was impossible. But Ben Kirtman, who as a teenager became fascinated by the impacts of weather after heavy rains flooded his Southern California home’s basement, proved the naysayers wrong.

Pooling the powerful resources of the Rosenstiel School of Marine and Atmospheric Science with entities like NASA and the National Oceanic and Atmospheric Administration (NOAA), Kirtman spearheaded the creation of a model that has been every bit the scientific version of a crystal ball when it comes to producing accurate, real-time, and long-range forecasts for a multitude of weather events.

 IDSC RSMAS -SubX poster

Since its rollout four years ago, the Subseasonal Experiment, or SubX for short, has performed remarkably well, accurately predicting a variety of harsh weather events. These include the severe cold wave that hit the midwestern United States and eastern Canada in early 2019, the Fourth of July heat wave that enveloped Alaska later that year (temperatures reached 90 degrees in Anchorage), and the extreme rainfall from Tropical Storm Isaias that drenched the Caribbean and U.S. East Coast in the summer of 2020.

But what makes those forecasts and others so exceptional is the time factor. SubX generated those weather outlooks weeks in advance—and in the case of Isaias, nearly a month before the storm even formed. Its latest forecasting feat? Early this year, it accurately forecasted nearly a month in advance the collapse of the Arctic polar vortex that brought freezing temperatures, snow, and ice to many parts of the U.S., with Texas being hardest hit.

How It Works

A plethora of different forecast models is the key to SubX’s exceptional precision. In addition to forecasts produced by the Rosenstiel School, NASA, and NOAA, SubX incorporates models from the U.S. Navy, Environment Canada, and the National Center for Atmospheric Research, creating real-time weather outlooks three to four weeks into the future. 

“The diversity of tools—in this case, multiple forecasts— is critical,” explains Kirtman, professor and director of the Cooperative Institute for Marine and Atmospheric Studies at the Rosenstiel School, as well as deputy director for the University’s Institute for Data Science and Computing. “Just like the diversity of ideas in an institution is important to come up with the best solution, the diversity of prediction tools is important here because any one model has biases,” he says. “If we had used only one tool that wasn’t very good at predicting the breakdown of the polar vortex, we would have missed accurately forecasting that event.” 

The degree to which those six models will agree varies. In some cases, one model may break from the others, rendering a completely different forecast. “You want to factor in the chance that you might be wrong, and the best way to explore a realistic assessment of the range of possible outcomes is to use a multi-model approach,” Kirtman says. 

Five of the six models predicted the 2021 polar vortex breakdown, with the forecast generated by the Rosenstiel School being the most accurate, according to Kirtman. “But there’ll be times when our model isn’t the best,” he explains. “Sometimes, it’s going to be the best. Sometimes it’s going to be the worst. Sometimes it’s going to be the middle of the pack. That’s the strength of the system.” 

And whether it be one model operating best over the Indian summer monsoon region or another that performs well over Southern California, each has its own strengths and weaknesses, Kirtman notes. “It’s also dependent on what time of the year the forecasts are made. If we’re in an El Niño or La Niña year, some models may perform better than others,” says the researcher, referring to the periodic changes in Pacific Ocean sea surface temperatures that can affect weather around the globe. 

Along with atmospheric data, all of the models factor in oceanic conditions. “In the past, we haven’t done that,” Kirtman notes.

IDSC - Ben Kirtman

Models Powered By Supercomputer

The process by which those models are constructed is grounded in computing. In a comprehensive process of data assimilation, SubX scientists incorporate an abundance of information—culled from satellite telemetry, weather balloons, ocean buoys, drones, and radio sondes—into each of the six models, feeding the data into powerful supercomputers that make the complex computations required to produce the forecasts. “The entire international observing system is leveraged,” Kirtman says.

The Rosenstiel School relies on the power of Triton, the supercomputer of the University of Miami Institute for Data Science and Computing, to build its forecast.

With upgrades of each model occurring at different times, SubX will continuously evolve, Kirtman points out. “Every year or so there’s a new version of a model coming into the system and an old model cycling out. So that leads to constant improvement.” 

IDSC RSMAS Cloud SubX 6panels

SubX is not the first forecasting tool to use a multi-model approach. Ten years ago, Kirtman played an instrumental role in developing the North American Multi-Model Ensemble (NMME), a seasonal forecasting system consisting of several different models from a conglomerate of North American-based modeling centers.

But the NMME differs from SubX in the type of models used and the frequency in which they are issued. “The overlap is in the basic concept that the multi-model approach is the best technique for producing well-calibrated, robust estimates of what future weather is going to look like,” says Kirtman. “With the NMME, we’re looking at what’s going to happen six to nine months from now, so the update cycle is much less—once a month, actually. SubX has a much higher frequency of forecasts. We want to know what weeks three and four are going to look like. So we’re updating that forecast every seven days.”

The SubX forecasts are global in nature, and regional and local forecasters can use them to construct more location-specific forecasts for their area, “a detailed outlook of what’s happening over Miami, for example,” Kirtman indicates.

While SubX has been remarkably accurate in forecasting environmental hazards like the collapse of the polar vortex and the subsequent frigid weather that sent Texas plunging into a deep freeze, the project is still experimental and lacks the official NOAA endorsement that’s been bestowed upon the NMME. “SubX data aren’t run through a government computer. So getting people to use it when it doesn’t have that umbrella over it has been a challenge,” Kirtman says. But given the experiment’s success rate, that could and quite probably will change.

 Texas Freezing Temperatures

Nearly a month in advance, subx accurately forecasted the collapse of the Arctic polar vortex that brought freezing temperatures, snow, and ice to many parts of the U.S.., with Texas (above) being hardest hit.

Benefit to Society

In the hands of emergency managers, utility companies,and corporations, the publicly available SubX data can bea powerful tool, allowing such entities to make criticaldecisions such as when to stockpile energy resources,insulate pipes, or reposition line workers and bucket trucks.Such entities are already making use of SubX’s publiclyavailable data. But to what extent, Kirtman isn’t sure.

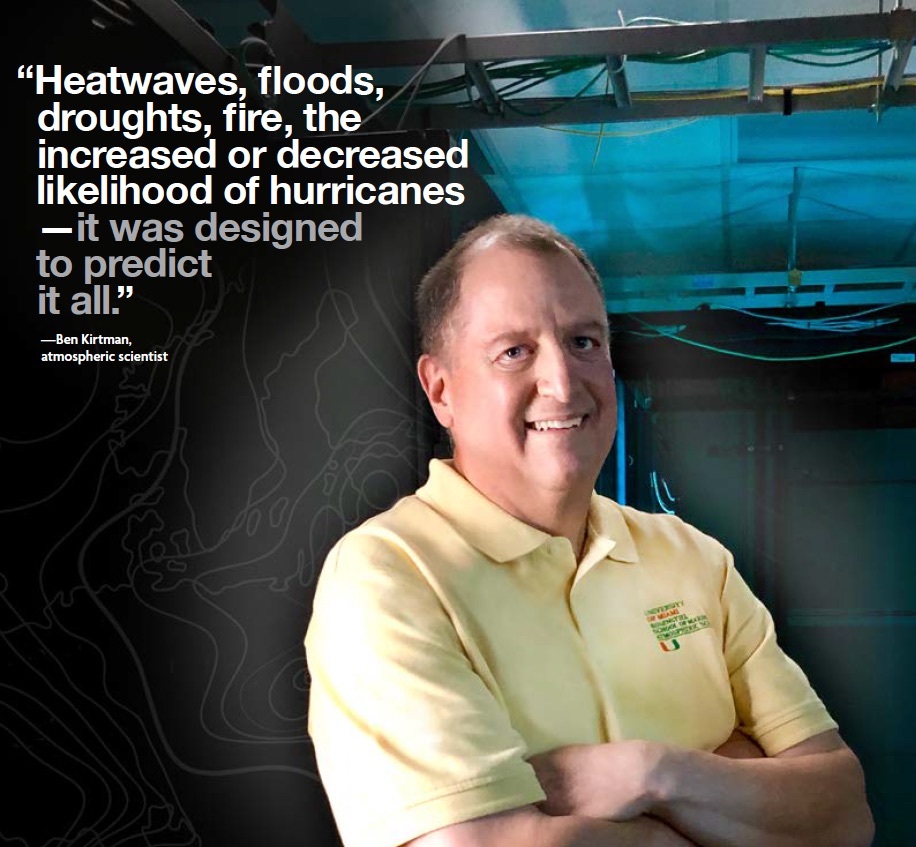
“We know a little bit just based on what they’re asking for. The Air Force once asked for specialized graphics, for example,” Kirtman recalls. “But the way to think about the interaction with users is that it covers an entire range. Some users are very sophisticated. They’ll download our data directly and not tell us anything about what they’re doing and produce all kinds of value-added products. And we encourage
that. We like to hear back from them once in a while,” he adds. “A lot of private sector folks are using
it. But they just don’t tell us about it. We try to document how much they’re downloading, but we don’t know how they’re benefiting from it because a lot of what they do is proprietary.”

With SubX being funded by NOAA, an agency within the U.S. Department of Commerce, that process, according to Kirtman, “is exactly the way it should happen, driving economic return. We provide the backbone. Whether that be in a particular region or for a particular business sector, they’re driving their decision-making based on the output of our forecasts.” What Kirtman does know is that people in the energy and agricultural sectors can be very sophisticated in how they’re using SubX data. A public utility company in the Northeast, for example, could learn about a cold-air outbreak that could impact a certain area three to four weeks from now and make the critical decision to move natural gas into thatregion ahead of the harsh conditions. “Or if they’re a farmer in Florida and know there’s a freeze coming three to four weeks from now, they have plenty of time to pivot in terms of protecting crops,” Kirtman explains.

And therein lies the strength of long-range forecast models like SubX. “The better the forecast, the better the goal that can be achieved when it comes to preemptively closing roads, evacuating people from an area, deploying manpower, of preparing a structure,” says Renato Molina, an assistan professor of environmental and resource economics at the Rosenstiel School, whose research focuses on everything from conservation to the impact of natural disasters. 

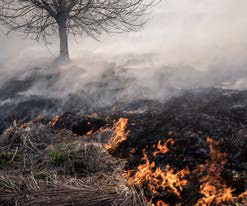
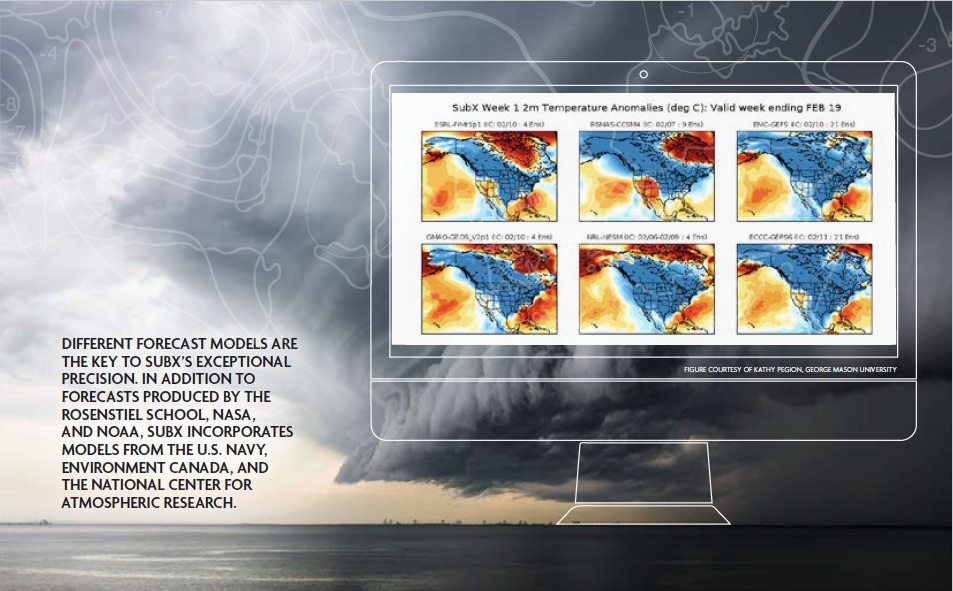
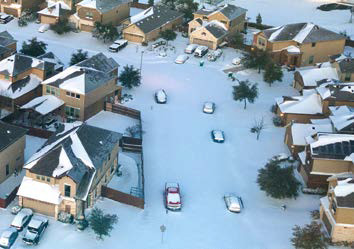
The winter weather disaster that hit Texas crippled that state’s power grid and claimed dozens of lives. SubX models began issuing forecasts related to that system back in mid-January, warning that a collapse of the polar vortex—the massive area of cold air spinning high in the atmosphere above the Arctic—would occur in the next three to four weeks. Then, a month later, that prediction held true, whena blast of ultra-cold air from Canada brought the season’s harshest weather to the central United States.

Baloon_Triton_coastal_Flooding

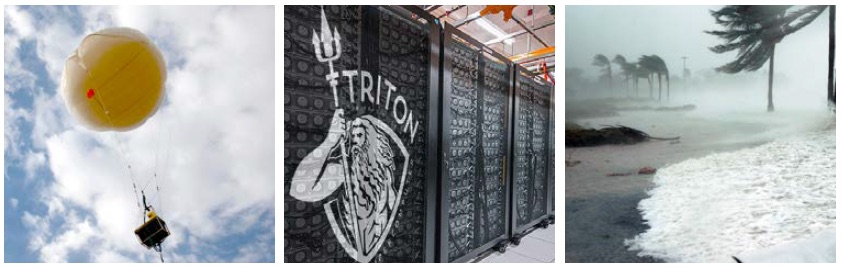
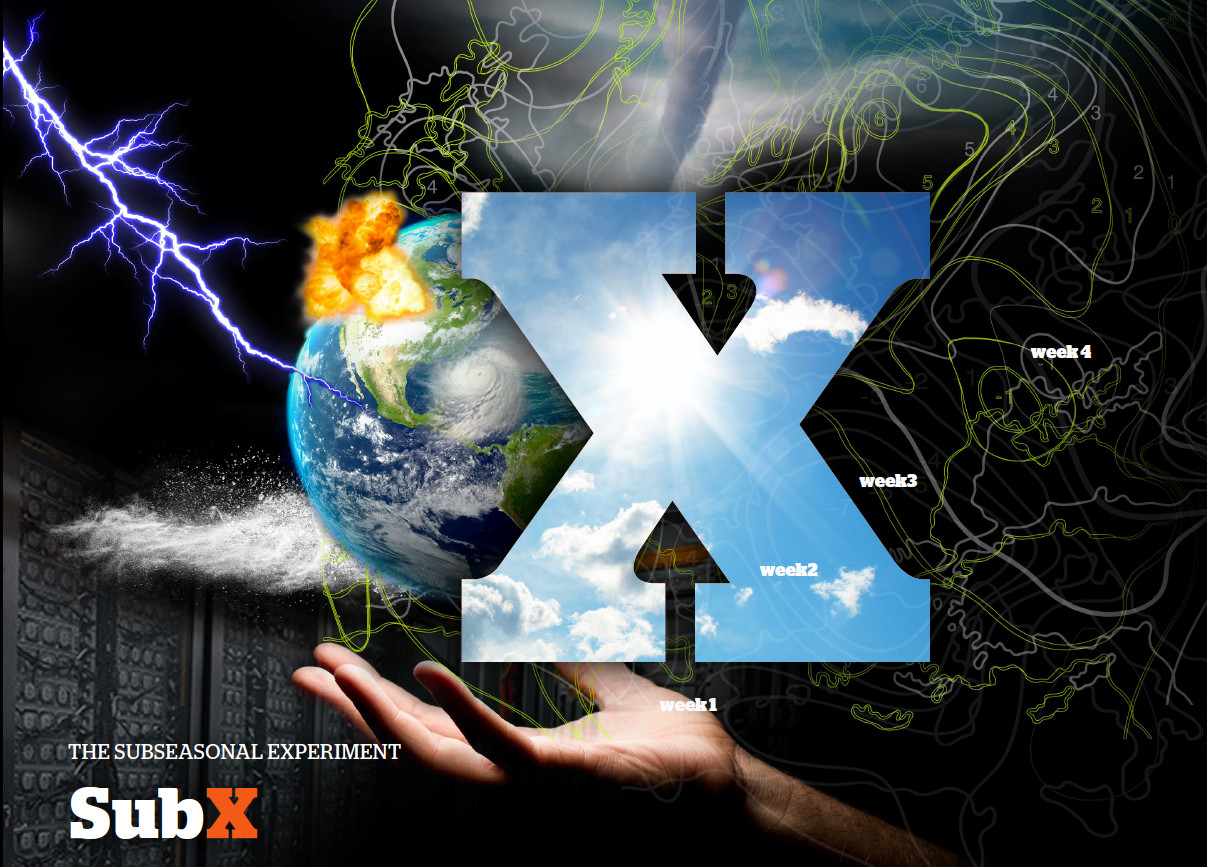
Subx scientists incorporate information culled from satellite telemetry, weather balloons (top left), ocean buoys, drones, and radio sondes.

The Rosenstiel School utilizes Triton, the supercomputer of the University Of Miami Institute For Data Science And Computing, to build its forecast (center)

But were Texas officials caught flat-footed? Could lives and critical infrastructure have been saved?

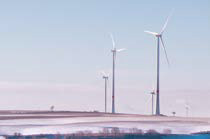
Whether it be insulating pipes and making sure windmills work in cold weather, public utilities typically take measures to mitigate potential risks from severe weather, says David Kelly, a professor of economics in the Miami Herbert Business School, whose many research interests include government policy and  the environment as well as adaptation to climate change. “But there’s always the question of whether something is going to be a once-in-a-hundred-year event that you should be prepared for, or is it a once-in-a-thousand-year event that’s just too remote of a
possibility to control for,” Kelly notes. “But most everyone should be aware of weather risks. They should have been prepared For it. And that points to the value of having good long-range forecasts.”

While SubX can help emergency managers and utilities prepare for natural disasters like the brutal winter storm that devastated Texas, “there is a certain amount of pressure on our team to start to seek out people who are interested in using it,” Kirtman says. It is a difficult process to build that kind of trust, but the SubX team seems to be winning over more constituents. 

“As scientists, knowing that we’re working on something  that’s actually going to help society matters,” he says. “People are making decisions to save lives and protect economic security using the data we produce—and that’s huge.”

By Robert C. Johns, Jr.

Forest Fire   Wind Mills